Affine invariant image comparison under repetitive structures
Guide to estimate tilt tolerances
In order to estimate the tilt tolerance of AC-Q, AC-W, SIFT, and RootSIFT, under repetitive structures, a MATLAB function in our Tester source code was used. The github repository already comes with the image data base proposed in this paper. They are called upon by “tolerance_test_ICIP.m” .
Use the following code to reproduce our tests !
num_test = 100;


im1 = double(imread('./image_BD/enami.png'));
im2 = double(imread('./image_BD/porta.png'));
im3 = double(imread('./image_BD/adam1.png'));

matrixgood = [];
matrixratio = [];
tvec = 1:0.1:3;
for t=tvec
    ratiovec = 0;
    goodvec = 0;
    badvec = 0;
    grafratio = [];
    grafgood = [];
    grafbad = [];
    figure;
    for i=1:num_test
        [goodm, badm] = tolerance_test_ICIP( im1, im2, im3, 100, 3, t, randi([0 179]) );
        ratio = goodm./(goodm+badm);
        ratio(isnan(ratio)) = 0.5; % definition 0/0 = 0.5

        ratiovec = ratiovec + ratio;
        goodvec = goodvec + goodm;
        badvec = badvec +badm;

        grafratio = [grafratio; ratio];
        grafgood = [grafgood; goodm];
        grafbad = [grafbad; badm];

        subplot(2,2,1);
        plot(1:i,grafratio(:,1),'-xc');hold on;
        plot(1:i,grafratio(:,6),':xc');
        plot(1:i,grafratio(:,2),'-+m');
        plot(1:i,grafratio(:,7),':+m');
        plot(1:i,grafratio(:,3),'-sb');
        plot(1:i,grafratio(:,4),'-ok');
        %plot(1:i,grafratio(:,5),'-*r');hold off;
        legend('SIFT L1 0.8','SIFT L1 0.6','RootSIFT 0.8', 'RootSIFT 0.6', 'Weights', 'Quantised 0.3');%,'SURF');
        title('Ratio')
        axis auto;

        subplot(2,2,2);
        plot(1:i,cumsum(grafratio(:,1),1)./((1:i)'),'-xc');hold on;
        plot(1:i,cumsum(grafratio(:,6),1)./((1:i)'),':xc');
        plot(1:i,cumsum(grafratio(:,2),1)./((1:i)'),'-+m');
        plot(1:i,cumsum(grafratio(:,7),1)./((1:i)'),':+m');
        plot(1:i,cumsum(grafratio(:,3),1)./((1:i)'),'-sb');
        plot(1:i,cumsum(grafratio(:,4),1)./((1:i)'),'-ok');
        % plot(1:i,cumsum(grafratio(:,5),1)./((1:i)'),'-*r');hold off;
        legend('SIFT L1 0.8','SIFT L1 0.6','RootSIFT 0.8', 'RootSIFT 0.6', 'Weights', 'Quantised 0.3');%,'SURF');
        title('Mean Ratio')
        axis auto;

        subplot(2,2,3);
        plot(1:i,grafgood(:,1),'-xc');hold on;
        plot(1:i,grafgood(:,6),':xc');
        plot(1:i,grafgood(:,2),'-+m');
        plot(1:i,grafgood(:,7),':+m');
        plot(1:i,grafgood(:,3),'-sb');
        plot(1:i,grafgood(:,4),'-ok');
        %plot(1:i,grafgood(:,5),'-*r');hold off;
        legend('SIFT L1 0.8','SIFT L1 0.6','RootSIFT 0.8', 'RootSIFT 0.6', 'Weights', 'Quantised 0.3');%,'SURF');
        title('Good')
        axis auto;

        subplot(2,2,4);
        plot(1:i,cumsum(grafgood(:,1),1)./((1:i)'),'-xc');hold on;
        plot(1:i,cumsum(grafgood(:,6),1)./((1:i)'),':xc');
        plot(1:i,cumsum(grafgood(:,2),1)./((1:i)'),'-+m');
        plot(1:i,cumsum(grafgood(:,7),1)./((1:i)'),':+m');
        plot(1:i,cumsum(grafgood(:,3),1)./((1:i)'),'-sb');
        plot(1:i,cumsum(grafgood(:,4),1)./((1:i)'),'-ok');
        % plot(1:i,cumsum(grafgood(:,5),1)./((1:i)'),'-*r');hold off;
        legend('SIFT L1 0.8','SIFT L1 0.6','RootSIFT 0.8', 'RootSIFT 0.6', 'Weights', 'Quantised 0.3');%,'SURF');
        title('Mean good')
        axis auto;


        refresh;
        pause(0.2);
    end

    %means
    matrixratio = [matrixratio; ratiovec/num_test];
    matrixgood = [matrixgood; goodvec/num_test];
    badvec/num_test

    if (false)
        save(['matlab_t_' num2str(t) '.mat']);
    end
end


figure;
plot(tvec,matrixratio(:,1),'-xc');hold on;
plot(tvec,matrixratio(:,6),':xc');
plot(tvec,matrixratio(:,2),'-+m');
plot(tvec,matrixratio(:,7),':+m');
plot(tvec,matrixratio(:,3),'-sb');
plot(tvec,matrixratio(:,4),'-ok');
        legend('SIFT L1 0.8','SIFT L1 0.6','RootSIFT 0.8', 'RootSIFT 0.6', 'AC-W', 'AC-Q 0.3');%,'SURF');
        xlabel('Viewpoint angle')
        ylabel('Mean');
        xticks(1:0.1:3)

        label = {};
        for tilt=1:0.1:3
            label = [label {[num2str(round(180*acos(1/tilt)/pi)) '\circ']}];
        end
        xticklabels(label)
title('Ratio')

figure;
plot(tvec,matrixgood(:,1),'-xc');hold on;
plot(tvec,matrixgood(:,6),':xc');
plot(tvec,matrixgood(:,2),'-+m');
plot(tvec,matrixgood(:,7),':+m');
plot(tvec,matrixgood(:,3),'-sb');
plot(tvec,matrixgood(:,4),'-ok');
        legend('SIFT L1 0.8','SIFT L1 0.6','RootSIFT 0.8', 'RootSIFT 0.6', 'AC-W', 'AC-Q 0.3');%,'SURF');
        xlabel('Viewpoint angle')
        ylabel('Mean');
        xticks(1:0.1:3)

        label = {};
        for tilt=1:0.1:3
            label = [label {[num2str(round(180*acos(1/tilt)/pi)) '\circ']}];
        end
        xticklabels(label)
title('Good')
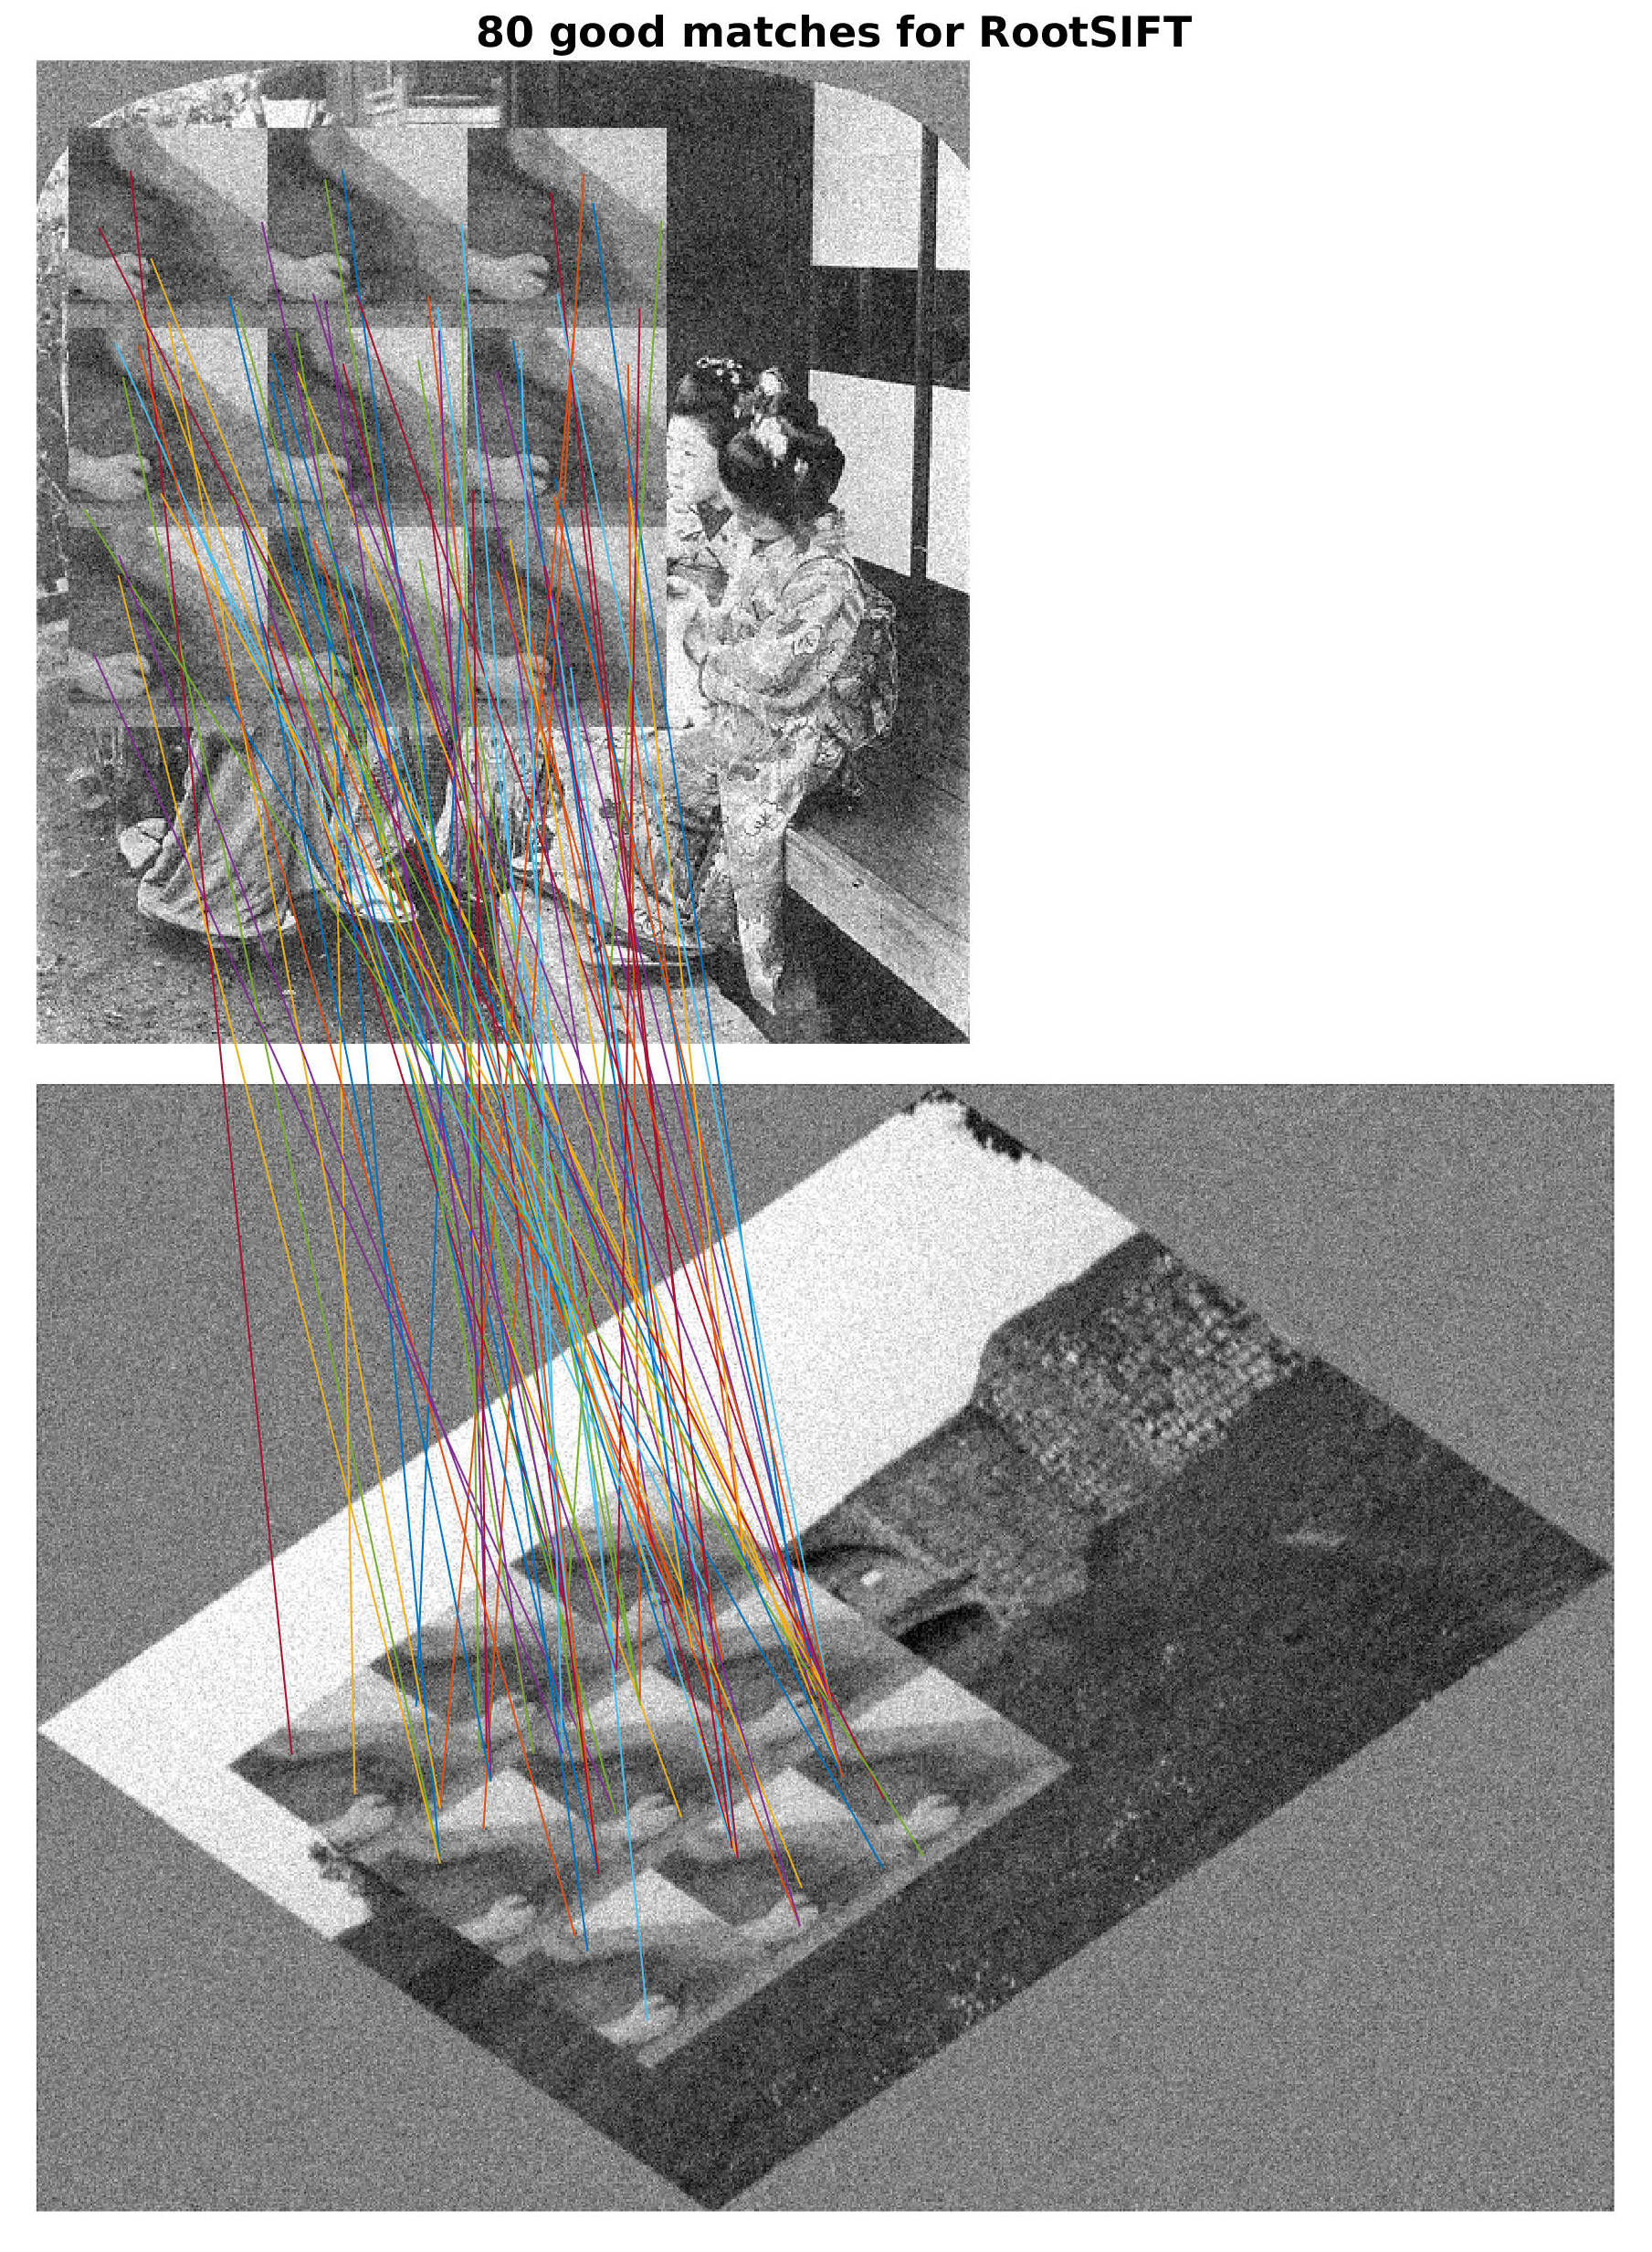
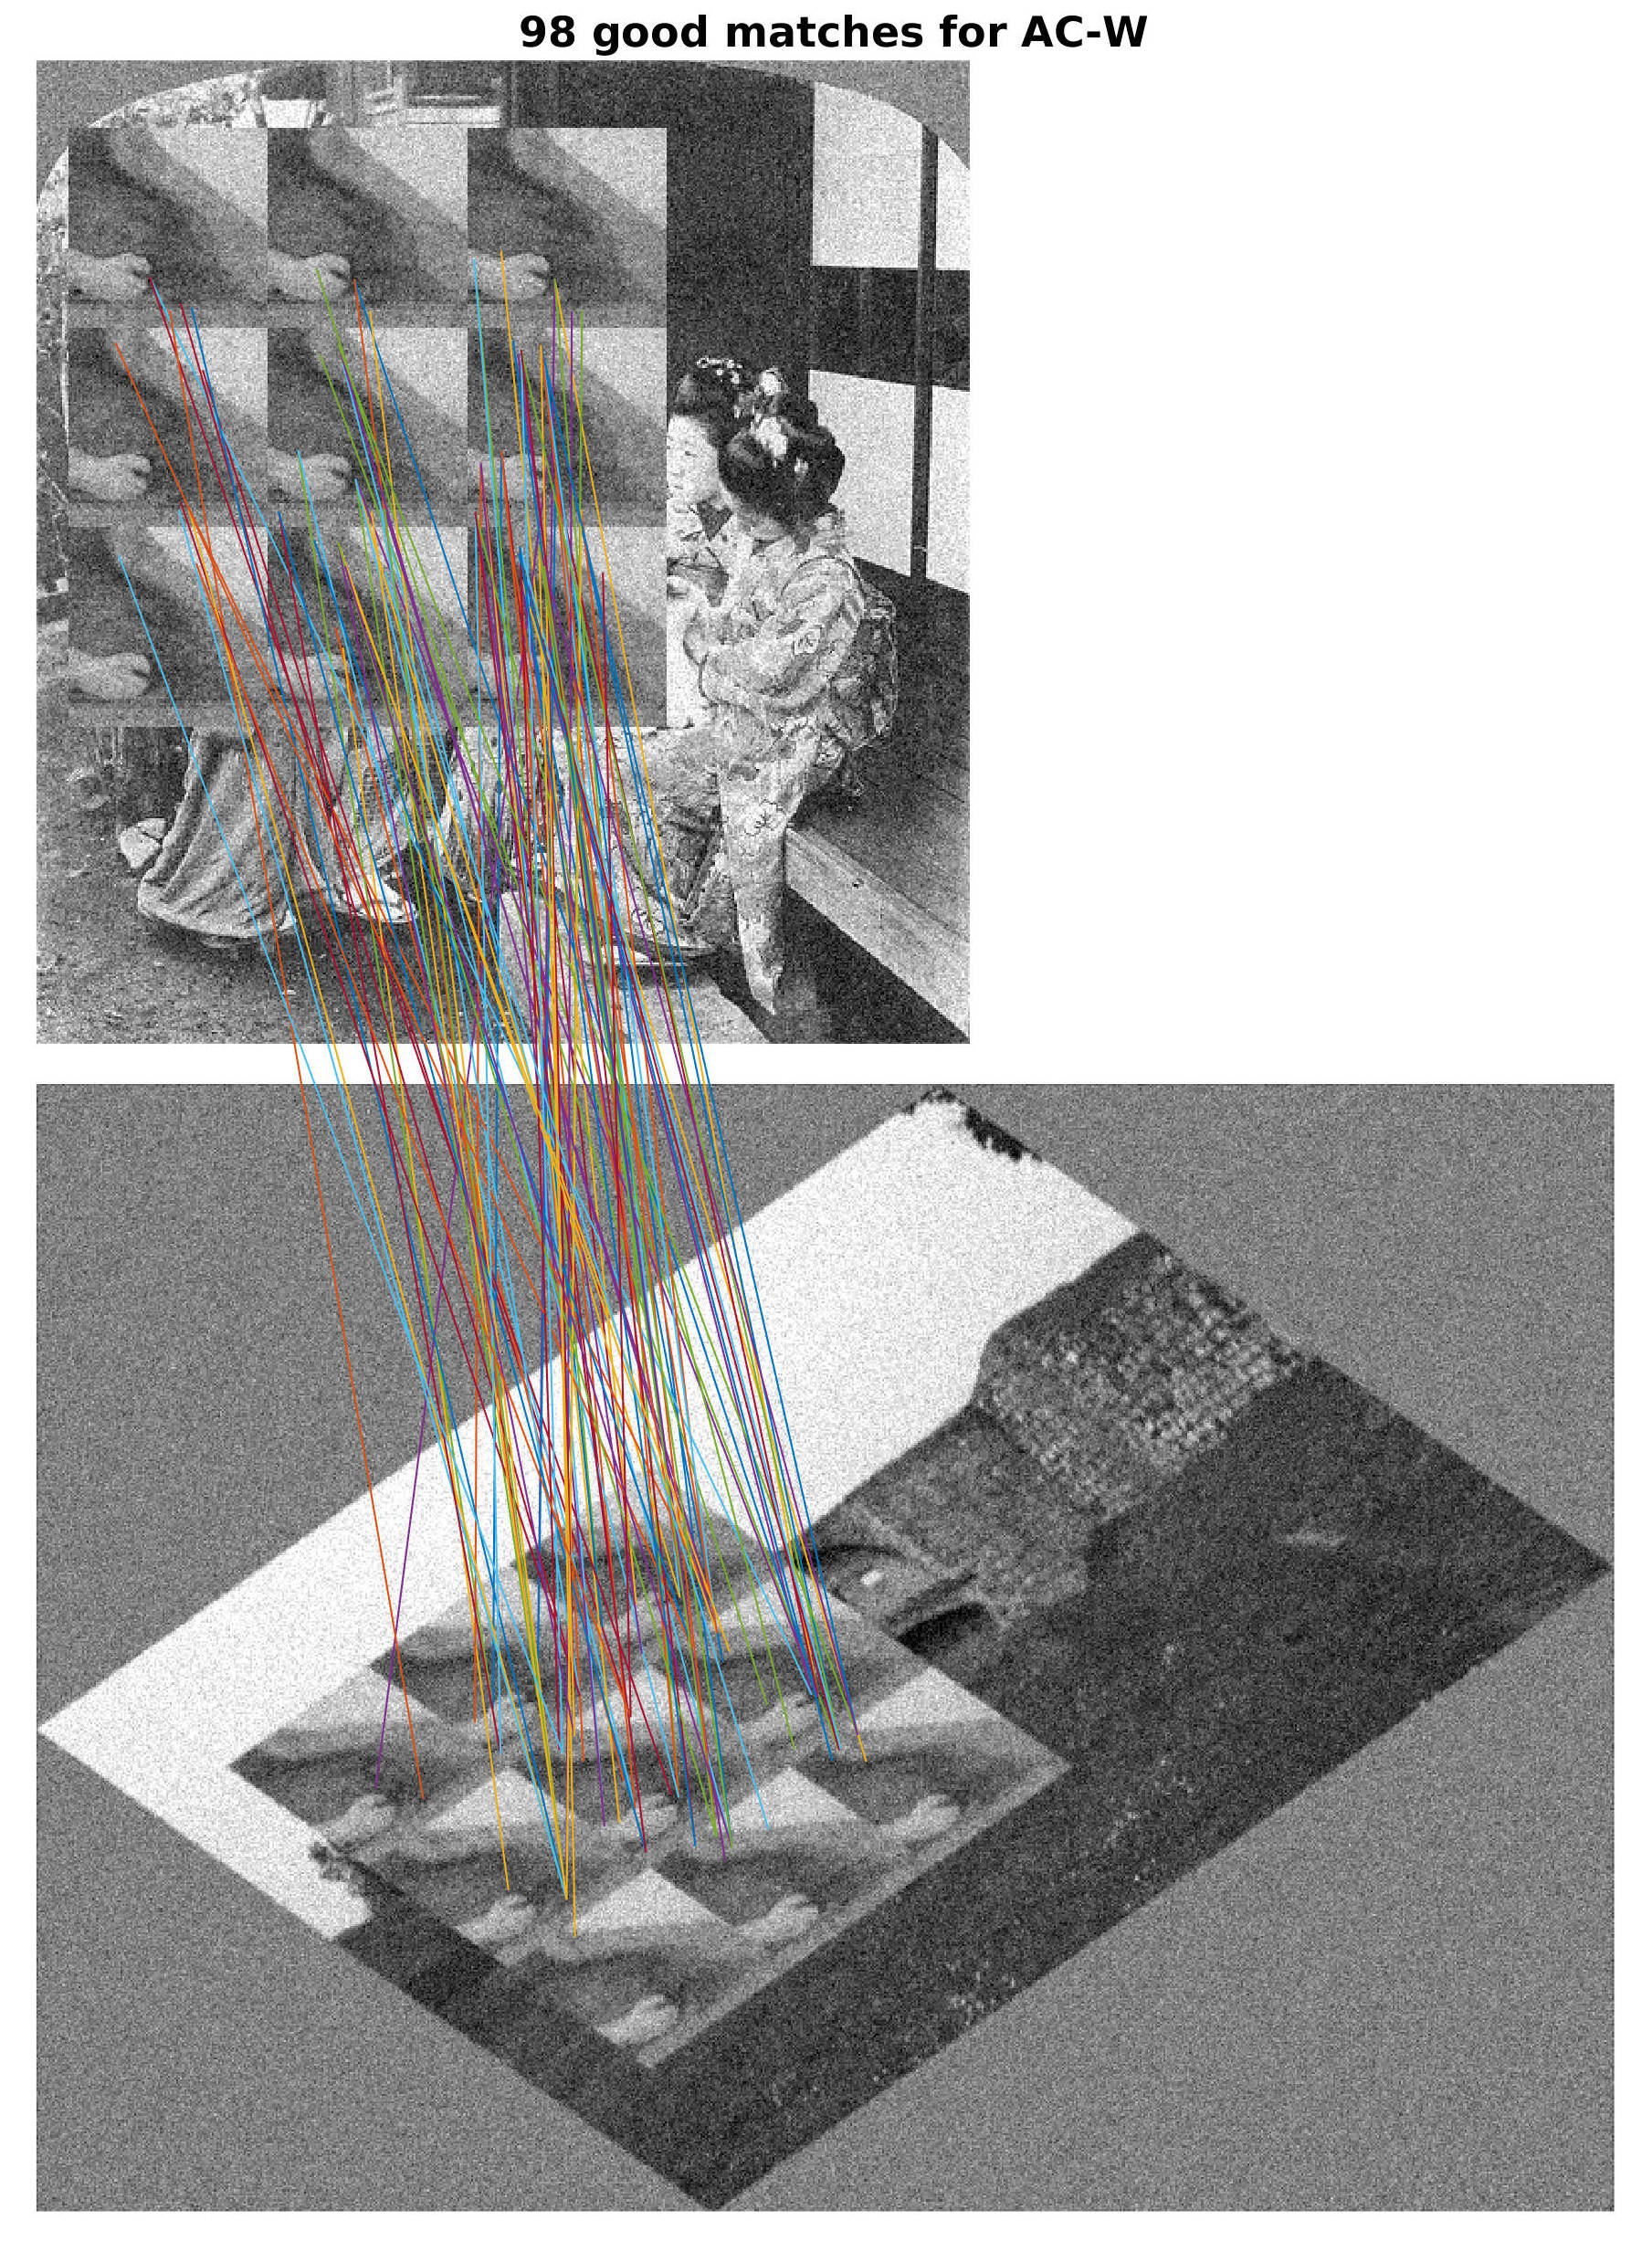
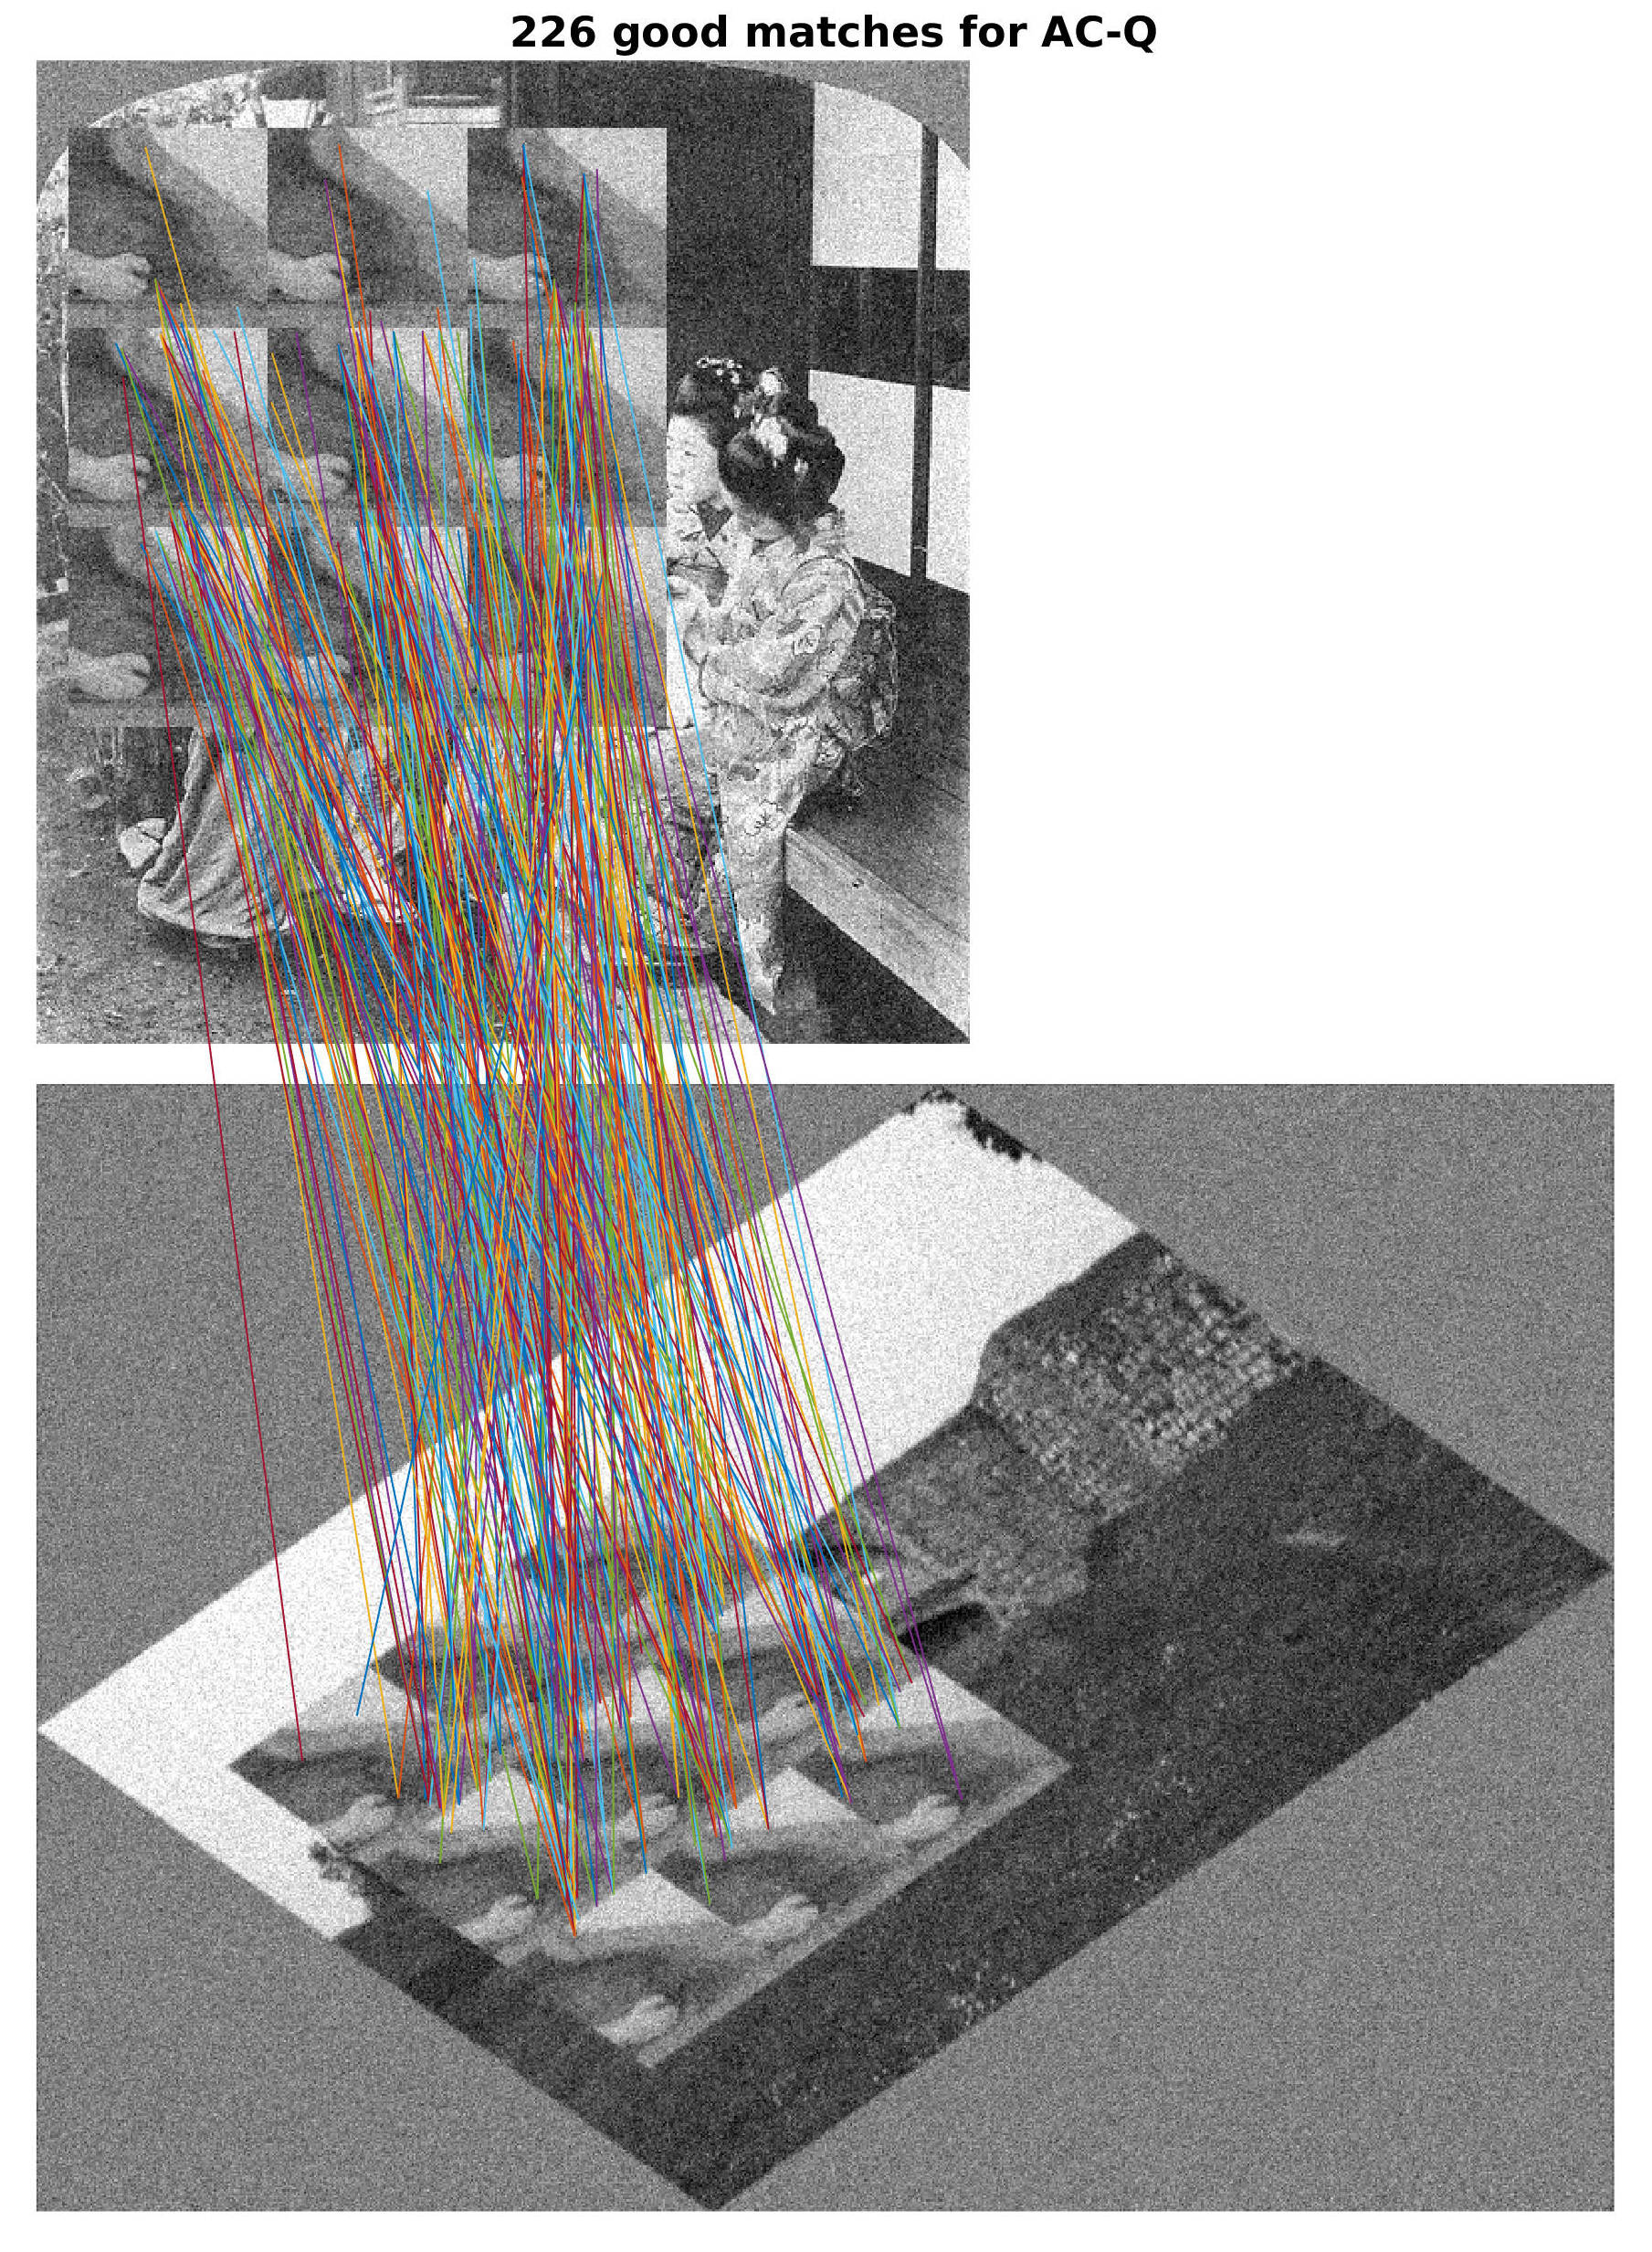
For example, here is one pair of generated images in the oblique performance test for an affine transform \(A=T_{1.4} R_{45^\circ}\). Lets see visually the results for RootSIFT (80 true / 82 false), AC-W (98 true / 46 false) and AC-Q (226 true / 37 false).